
Long read · Manufacturing · Digital twins · Predictive maintenance · Industry 4.0
Digital twins, explained: how a factory learns to see, predict and test itself
A digital twin is a live model, not a picture. Jenit Ramaiya of Ambit Software on predictive maintenance, what-if analysis and 15 production lines at LG Electronics.
AI Reality Check · · 9 min read
"Digital twin" is one of those phrases that has been stretched until it fits almost anything: a dashboard, a CAD model, a 3D walkthrough for a trade show. The version Jenit Ramaiya set out at AI Reality Check is narrower and more useful, and it comes with a test you can apply to any claim: does it change what the factory does?
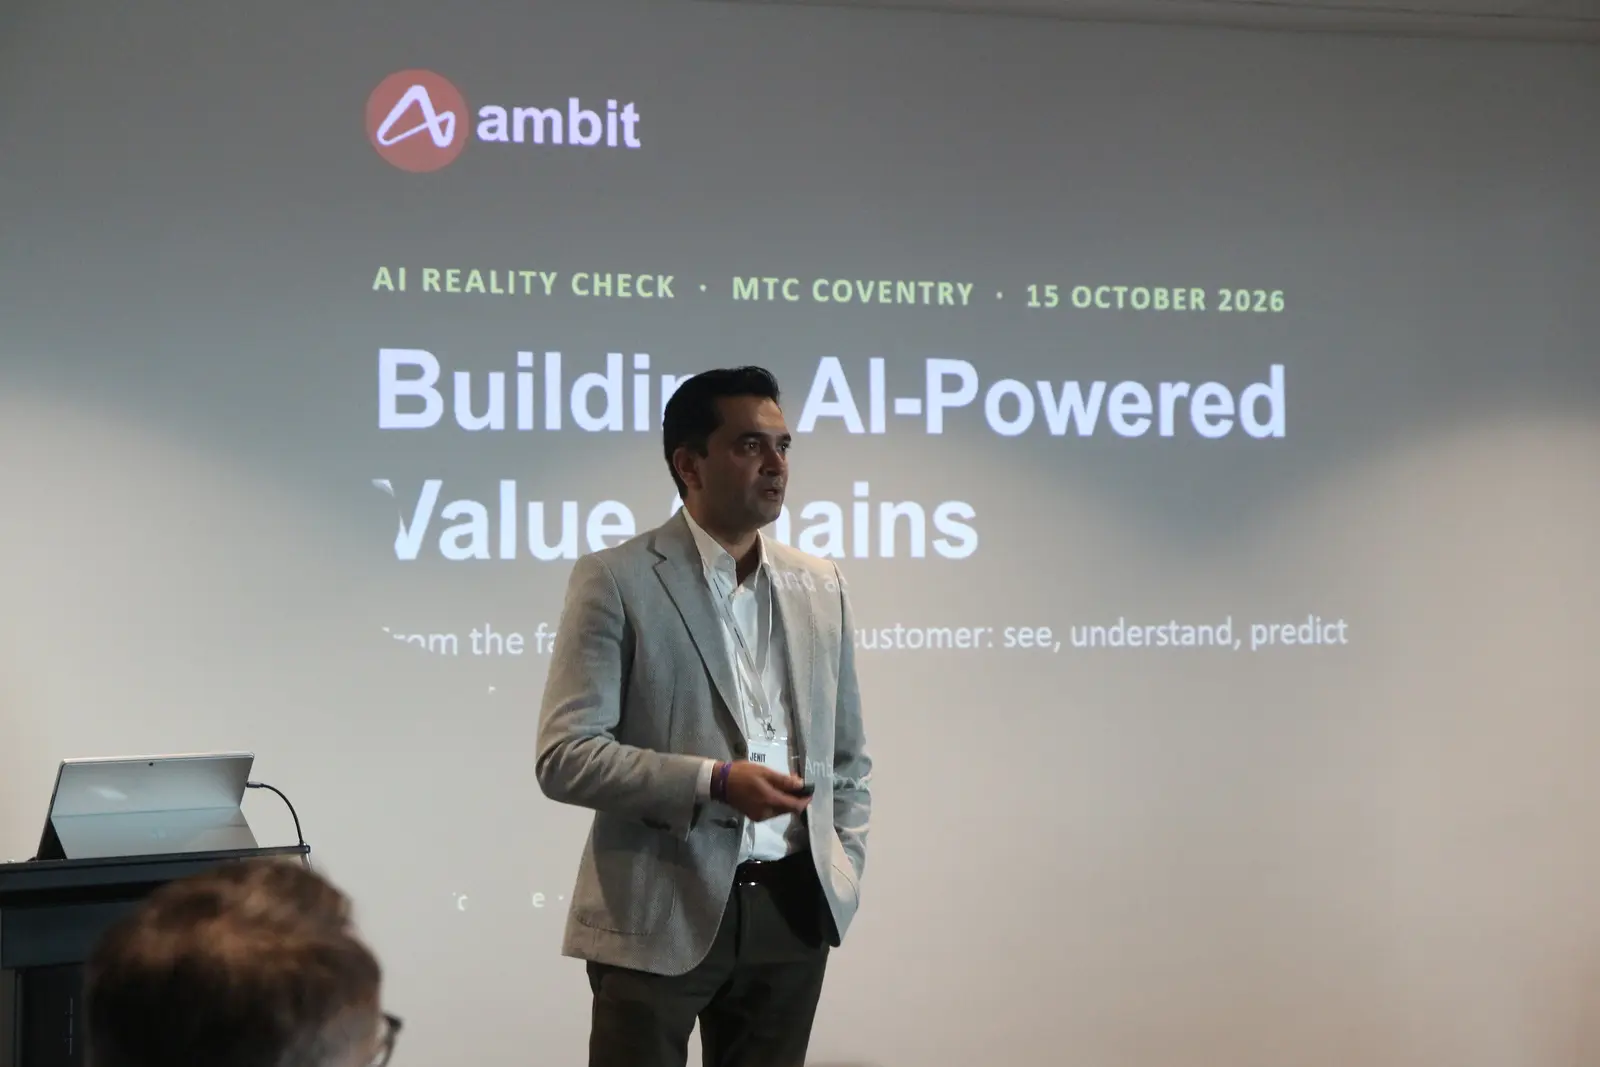
Jenit is CEO and Managing Director of Ambit Software, which helps enterprises use AI across their value chains. The session, "Building AI-Powered Value Chains", was held at the Manufacturing Technology Centre in Coventry on 15 October 2026, and carried the subtitle "From the factory floor to the customer: see, understand, predict and act". Its first section was about the digital twin of a production plant. This essay follows that thread, explains the terms along the way, and ends with some questions to ask before starting.
See, understand, predict, act
The session frames everything with one sentence: "Every business has a value chain. The next step is making it intelligent." A value chain here runs through five stages, from assets and production, through products and service, to customers. An AI and data layer connects them, and does four things in order. It shows what is happening, live. It explains why it is happening. It predicts what happens next. And it lets people act "with greater intelligence".
That sequence is a good way to read the rest of the session, because it also describes the order in which a company tends to mature. You cannot predict what you cannot see, and you cannot act sensibly on a prediction you do not understand.
A twin is a live model, not a picture
The definition on the slide is "a live, data-connected virtual copy of the factory". The machines, lines and processes are modelled in 3D, and they are fed with real-time data from sensors and controllers (IoT), from programmable logic controllers (PLCs) on the machines and from the manufacturing execution system (MES) that runs the shop floor, "so the screen shows what is happening on the floor right now". The 3D model is the part people see. The data is what makes it a twin.
One model, the session points out, answers different questions for different people, at three levels. The plant twin shows site-wide output, energy and alarms, along with OEE, overall equipment effectiveness, the standard measure that combines how much of the time a machine is available, how fast it runs and how much of what it makes is good. The production line twin shows flow, work in progress and throughput, station by station. The equipment twin shows the health, condition and live readings of each asset. On top sits an andon view, named after the signal used in lean manufacturing to call attention to a problem, which raises stoppages the moment they happen, by line, station and cause.
A maturity ladder
The session also gives a way to judge how far along a company is. It sets out a maturity model in five levels:
- Level 1, descriptive. 3D models and drawings, with scattered, static data in separate systems and no integration or automation.
- Level 2, diagnostic. A virtual model fed with operational and sensor data, and dashboards with operational insight.
- Level 3, predictive. Contextualised data and machine learning, with predictive maintenance and some automation across connected data and systems.
- Level 4, prescriptive. Real-time data from integrated systems, situational awareness, recommendations and what-if simulations.
- Level 5, autonomous. Continuous decision intelligence, adaptive and generative AI, and a convergence of the virtual and the physical.
Our reading is that the ladder is a warning against buying level four on top of level one. Each step needs the one beneath it: a recommendation is only as good as the live data it is made from. The two examples the session develops in detail, predictive maintenance and what-if analysis, sit at levels three and four.
Maintenance by condition, not by calendar
Maintenance timed by the real condition of each machine, not by the calendar or by a breakdown.
The slide sets three approaches side by side. Reactive maintenance happens after the machine breaks. Preventive maintenance happens on a schedule. Predictive maintenance happens "just before it fails". The case for the third is not hard to see: a calendar schedule replaces parts that still have life in them and misses the failure that arrives early.
AI helps in four steps. It senses: vibration, temperature, current and cycle data stream in from sensors and PLCs. It detects: models learn each machine's normal behaviour and flag drift early. It predicts: failure risk and remaining useful life are estimated for every asset. And it acts: a work order is raised, spare parts are checked and a technician is scheduled. In the slide's example, the line twin flags an overheating risk, checks spare parts and suggests the fix.
From alert to action
The next step in the session is the one that separates a twin from a monitoring screen: "The twin doesn't just show events, it responds to them." When a reading drifts or a threshold is breached, the next step starts automatically. Anomaly detection spots drift in temperatures, pressures and cycle times before it turns into scrap. Automated root-cause analysis correlates alarms, recipes, shifts and materials to suggest the likely cause. Triggered workflows, such as andon escalations, tickets, quality holds and updates to the ERP and MES, fire on their own. At the far end, closed-loop control suggests setpoint changes, or applies them with approval, to keep the process in spec. The phrase "with approval" is worth noticing: the session's own picture of the factory has a person signing off the actions that matter.
What-if: rehearsing change before you pay for it
Change one thing in the digital twin instead of the factory, and see the effect on throughput, cost and delivery before you commit time or capital.
This is the part of the session that is easiest to explain to a finance director. Instead of arguing about whether a change will help, the twin lets a company test it. The slide gives two families of question. On the process side: what if we add a parallel quality station, resize a buffer, or take a press down for maintenance? On the staffing side: what if 18% of the crew is absent, we run a 10-hour shift, or we cross-train floaters?
The engine behind it is Monte Carlo simulation, a method that runs a model many times with random variation in things like cycle times and absences, and reports the spread of outcomes rather than a single number. The slide's distribution view, hourly output from the 5th to the 95th percentile, is exactly that. According to the session, AI runs hundreds of such scenarios in minutes, finds the bottleneck, ranks the options and recommends the best move.
The worked example on the next slide shows what the output looks like. The AI flags a constraint in a foaming cell and recommends adding one operator. Simulating the suggestion projects 296 units per shift against a target of 290, with OEE at 74.9% and a labour cost of £8.43 per unit. The recommendation arrives with its effect on the business attached, which is what makes it something a manager can say yes or no to.
A case: 15 production lines at LG Electronics
The session's factory case study is LG Electronics. The challenge was a familiar one: operational data spread across production areas and systems, no central view of energy, environment, safety and line status, slow detection of issues, warnings and stoppages, and 50 to 60 employee applications with no single entry point.
What Ambit delivered, as presented: control towers integrated with plant systems, a digital twin portal with 3D and menu navigation, digital twins for 15 production lines, and andon, line status, process and machine dashboards. The business outcomes listed are specific:
- 15 to 20% less unplanned downtime, because andon flags line stoppages as they happen.
- About 30% faster response to stoppages, with live alerts by line, station and cause.
- 100% visibility of the mapped lines, with 15 lines monitored in one 3D twin.
- About 40% less reporting effort, because plan, result and defect figures update live.
- One portal for the 50 to 60 apps.
These are the presenter's figures for one deployment, and should be read that way. The qualitative description of the control room is the clearest part: stoppages "seen and acted on from one room, without walking the floor".
Beyond the plant
The session widens the idea in two directions.
The whole value chain. A twin of the chain puts suppliers, plants, ports, warehouses and customers on one live map. An event such as a plant stoppage, a port delay or a typhoon is flagged with its cost and a suggested reroute, and demand and lead-time forecasts update as conditions change. The same what-if logic applies at network scale: test a demand shock, a tariff or a disruption and see what it does to service, cost and stock before it happens.
The product. A digital product twin is "a continuously updated digital record of one serial-numbered product": how it was designed, built and tested, where it is installed, how it is performing and how it has been serviced. The session shows what that makes possible. Early warnings from the field, from sensor and usage data on installed products. Faster root cause, tracing a defect to the batch, the supplier lot and every affected unit in minutes. Lower warranty cost, because predictive service fixes problems before failure and cuts truck rolls. And compliance: the record can assemble the data needed for the EU's Digital Product Passport, which is being phased in under the Ecodesign for Sustainable Products Regulation, with certificates and declarations "attached to the product, not filed in a drawer".
From there the session follows the product into service, where IoT data predicts the failure and opens the service request automatically, and the work is planned, dispatched and closed against measures such as first-time fix and SLA compliance. It ends by tying the sections together in one line: "Different challenges. Different points in the value chain. One objective: make every decision more informed and every interaction more valuable."
Questions to ask before you start
These are ours, not the session's.
- Which decision would a live model change? Start from a decision, such as when to service a press or whether to add a shift, not from the technology.
- What data would the twin need, and is it already captured? Sensors, PLCs and the MES are the foundation of everything above level two.
- Where are you on the ladder, honestly? If the data lives in separate systems, the first job is connection, not prediction.
- Who approves an automated action, and who is accountable? The session's own examples keep a person in the loop for changes that matter.
- What would count as success in a number? Unplanned downtime, time to respond to a stoppage and reporting effort are the measures the LG case reported; pick yours before you begin.
- Can you start with one line? The LG deployment is 15 lines; the first one is the cheapest way to find out what you do not know.
The reason to take the idea seriously is the one the first slide gives. A factory that can see what is happening, understand why, predict what comes next and rehearse its options is not working harder, it is working with more information. That is a different kind of improvement from running the same plant faster.
Figures and quotations are from Jenit Ramaiya's session and the Ambit Software material presented at AI Reality Check (more at ambitsoftware.com); the definitions, the reading of the maturity model and the questions are ours. More from the day: the event recap, photos and video and Jenit's profile. Our next session is an online webinar on 26 November: join the list.